Imagine this scenario: your company is relatively healthy and becoming established in the market but needs to keep up a fast growth pace or maybe even to grow faster. Your heads of sales and marketing suggest that the best avenue to growth is that you need to add headcount in their respective departments. Hard to imagine this scenario, I know, but just try. You wonder whether you can analyze from the numbers whether or not the additional headcount will add revenue and at what cost to the overall picture.
SaaS company employee productivity
We looked at the group of all public SaaS companies and split them into two revenue groups: companies with revenues from $50 – $150 million and companies with revenues from $151 – $500 million in 2012. We took Q1 2013 financials. The first interesting trend that showed up was that, for both groups, employee productivity overall declined as headcount increased.
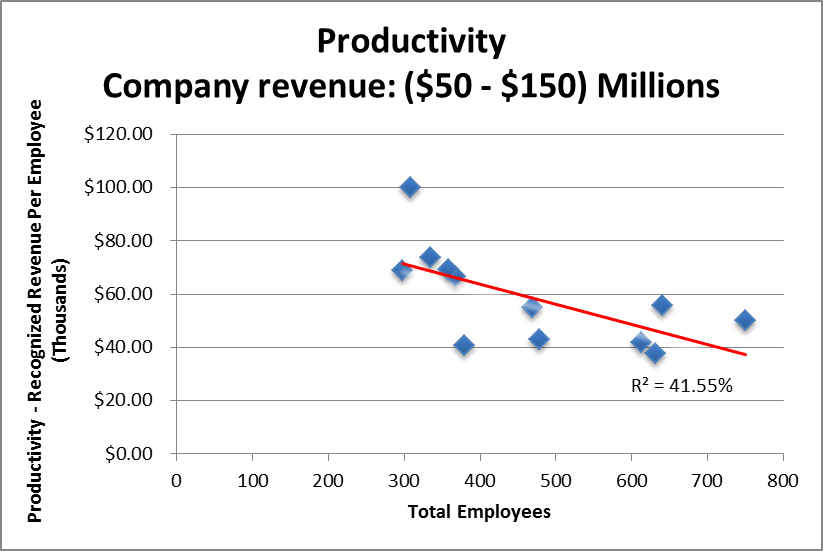
Source: OPEXEngine Financial Insights Reports, Q1’13
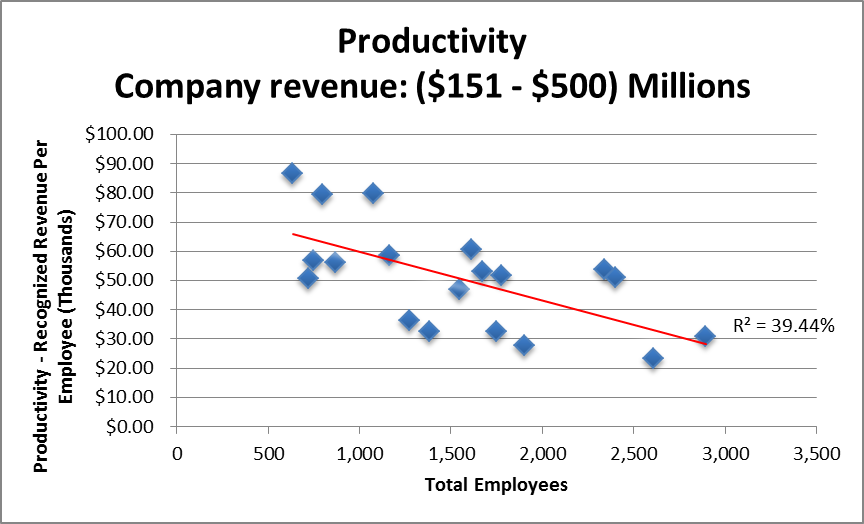
Source: OPEXEngine Financial Insights Reports, Q1’13
More employees equals lower productivity
It is also clear from the charts for each revenue group that the companies with the smallest headcount have the highest employee productivity. To some extent, that is obvious: if the revenue is divided by a smaller number, the result will be a higher number. But sometimes it is helpful to clearly see this laid out and to see by how much the number trends down as even the most experienced managers can get sucked into thinking that added headcount will at least maintain the revenue equal to the added cost.
Remember that all the companies in these peer groups earn the bulk of their revenues through recurring revenues, so presumably looking at Q1 of 2013 gives us the most recent information without much distortion by quarterly revenue roller coasters.
Sales and marketing spend per employee
So now let’s look at how Sales and Marketing spend per employee looks for these two groups. The average for the first group is $23,000 per employee, and the average for the second group is $18,000. Here’s how the individual companies look against the average for each set of companies:
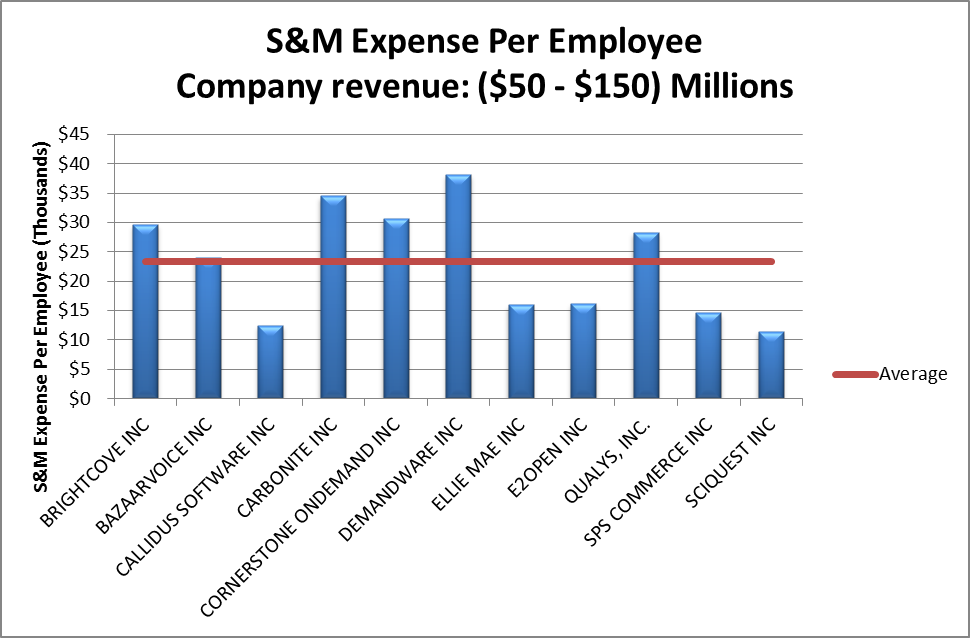
Source: OPEXEngine Financial Insights Reports, Q1’13
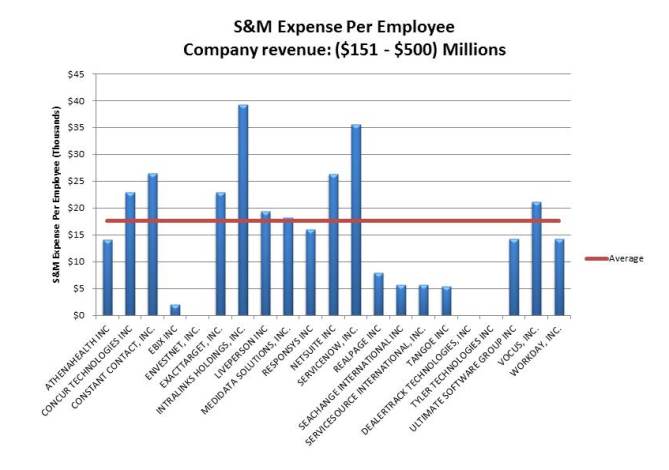
Source: OPEXEngine Financial Insights Reports, Q1’13
Increased sales and marketing spend correlates with higher productivity
The next set of charts shows S&M spend per employee against overall employee productivity. In both groups, it looks like there is a fairly strong correlation between increased S&M spend and increased employee productivity. In the first group, there is a particularly strong correlation with the exception of one outlier (Ellie Mae, Inc.) with relatively low S&M spend ($16,000/employee) and high employee productivity ($100,000/employee). Without Ellie Mae, the correlation is almost 73 percent.
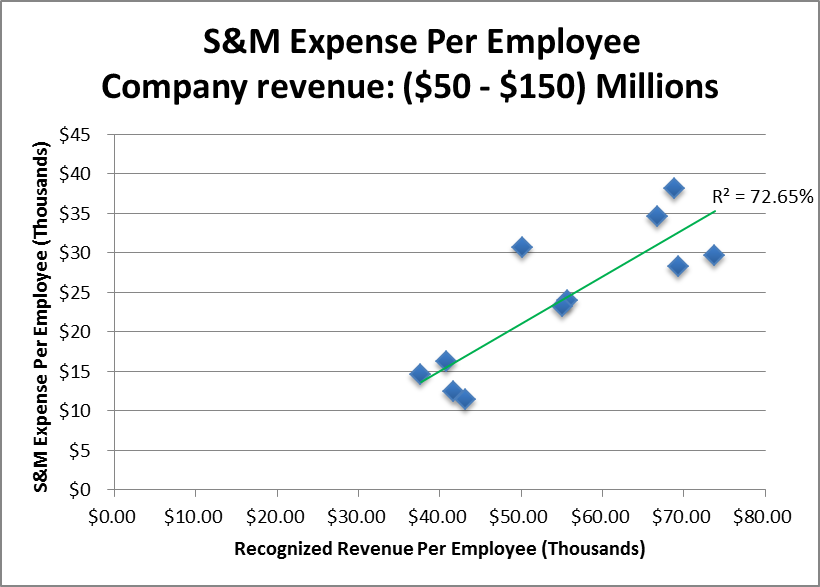
Source: OPEXEngine Financial Insights Reports, Q1’13
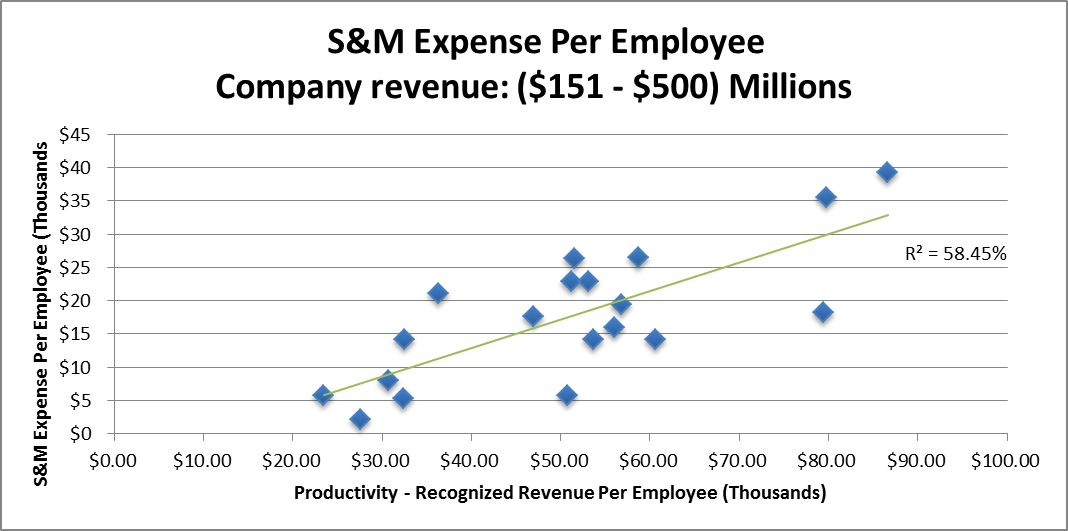
Source: OPEXEngine Financial Insights Reports, Q1’13
So, next time your heads of sales and marketing ask for additional headcount, or as you prepare to start the upcoming budgeting and planning season in the fall, analyze what that additional headcount is likely to get you in terms of revenue growth and how it will impact productivity. Additional headcount doesn’t always pay for itself, or contribute directly to growth; but some sales and marketing spending may well be worth the cost.
Of course, you can just throw additional headcount at growth or any issues you might be having and hope that it will work out … but your probability of success is higher from analyzing the results from your peers.
Lauren Kelley is CEO and founder of OPEXEngine. OPEXEngine develops comprehensive financial and management benchmarks for the software and SaaS industries. Clients use OPEXEngine’s reports to drive revenue and profitability, inform budgets and strategic planning and position their companies in the public and M&A markets. Five percent of OPEXEngine’s profits is given to charity. OPEXEngine’s latest report, the 2013 Software and SaaS Benchmarking Industry Report, will be available as of mid-July. Contact her at lauren@opexengine.com.
