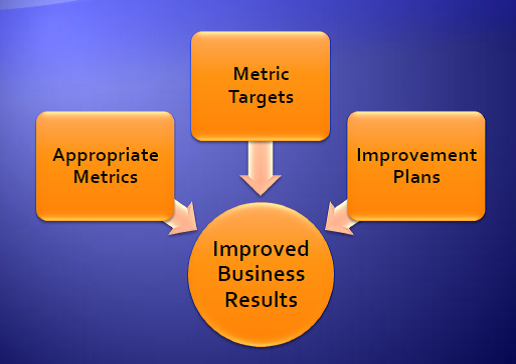
Using metrics as a roadmap to improving your SaaS business can be very effective. Metrics are also used by investors and others to value your business and compare it to other investment alternatives. Selecting the appropriate metrics, having the right targets and developing and implementing improvement plans are all important steps to that success.

A SaaS business should focus on only a few things:
- Recurring revenue
- Cost to produce the revenue
- Churn or the loss of any existing customers or revenue
- Sales cost to add additional recurring revenue
- Cash flow.
There are not any differences in measuring cash flow for a SaaS business versus other businesses, so that will not be an area of focus; however, as in all businesses, it is important and should not be forgotten.
In looking at metrics it is important to break metrics down into their components. It is an excellent way to have various parts of the business focus on the items they can influence and also see the high-level metrics they are working on to help improve the overall business. To effectively improve the business, it works best to engage the whole organization.
Investing SaaS recurring margin
Since a SaaS business is driven by recurring revenue, the margin that you get from the recurring revenue is an important concept. First, you have a certain amount of revenue from your current customers. From that you want to subtract any customer churn or loss of revenue from your existing customers and add any upsell or additional revenue from your existing customers. It then takes a certain amount of money to deliver the service, leaving a margin. This margin is the gross margin of the business.
Gross margin is a typical financial measurement; however it has some limitations. There are other recurring costs to keep the business running at its current level including the sales cost to maintain and renew the current customers, R&D required to maintain the current customers and certain G&A costs. Although putting these costs into the gross margin is not a standard financial measure, it is a good way to look at a SaaS business because this recurring margin is the amount of money that is left to invest in other things after doing all the things required to maintain the current level of business. But, once you understand these other costs it is usually best just to think about the more standard gross margin.
You then have some choices of how to invest this recurring margin. You can invest it in acquiring new customers, invest it in R&D, invest it in a new business area or take it as profit. Many fast-growing SaaS businesses including many large and public businesses invest as much as possible in acquiring new customers and growing the business. Many SaaS companies, including public companies, actually lose money although the recurring margin is positive and substantial.
R&D investments can help reduce churn, reduce the cost of delivering the service, increase upsell opportunities through new features or increase the efficiency of customer acquisition. These choices depend on what is most important to the business.
The right metrics
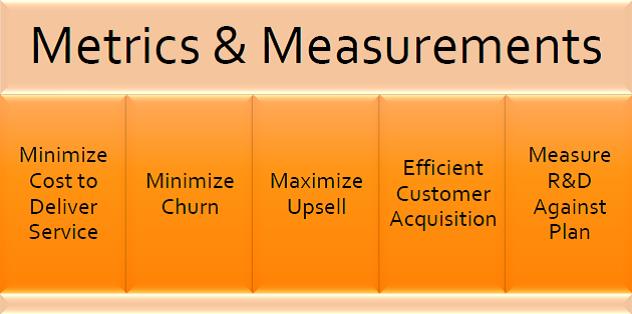
You need to have metrics on only five things, not counting cash flow, to effectively measure your SaaS business. You want to have metrics that will help you minimize the cost of delivering the service, minimize churn, maximize upsell, improve the efficiency of customer acquisition, and measure R&D results. There are many complex metrics that you often hear about to measure a SaaS business, but many of those are derivations or summations of the above and they can complicate the focus on these important items.

Cost to deliver service. To measure the cost of delivering service the gross margin is the best measure. Although the recurring margin is a more technically pure metric, it is not available for most companies for comparison purposes. Even though there are differences between the ways those companies measure gross margins, most companies do in fact measure it; so you can make comparisons. Public companies report gross margin in their financial statements.
A good set of things to focus on, as parts of the gross margin, are the infrastructure cost/$ of revenue, customer support costs/$ of revenue and customer onboarding time. Infrastructure and customer support costs are major components of the cost of delivering the service. For customer onboarding the time to value is a good proxy for cost, but it takes into account the additional aspect of customer satisfaction since customers typically want to use the application quickly. If you can successfully onboard new customers quicker, chances are the costs are lower.
In looking at the infrastructure support costs it is a good idea to split up the costs between the human support costs for the infrastructure and the actual hardware, software, and telecommunications costs. It’s good to break it down this way since the approach to analyzing and improving each of the areas is likely going to be different.
Churn. Churn, or its inverse customer retention, should be measured as a percentage of revenue. However, to understand where the churn is occurring it’s important to break it down further. Typically revenue from a customer is reduced or stopped based on the following reasons: non-renewing customers, reduced usage, reduced number of users, and downgraded features. The approach to making improvements is usually different for each of these categories.
When looking at customers that have not renewed, the reasons should be well understood and typically would include these categories: the customer went out of business, the customer isn’t happy with support or the customer is not happy with the value of the service. The exact categories depend on the specific business and it is important to understand each one of them separately since the improvements are like to be very different for each category.
Upsell. It’s important to measure churn, or the reduction of revenue separately from upsell, or an increase in recurring revenue. If you do not do this, you may be masking significant issues. Very successful upsell in one area may offset very poor retention in another area, making it look like you have average but acceptable overall customer retention. Typically any published real churn or retention numbers that you see include both churn and upsell and are usually referred to as retention percentages. The term “negative churn” is sometimes used when a business overall has a retention rate of over 100 percent, indicating that upsell has more than offset churn.
Upsell should also be measured as a percentage of revenue. Typical important categories include looking at the number of users, increased usage, increased features or any other pricing vectors you have. Track these factors closely so you can understand how to make improvements.
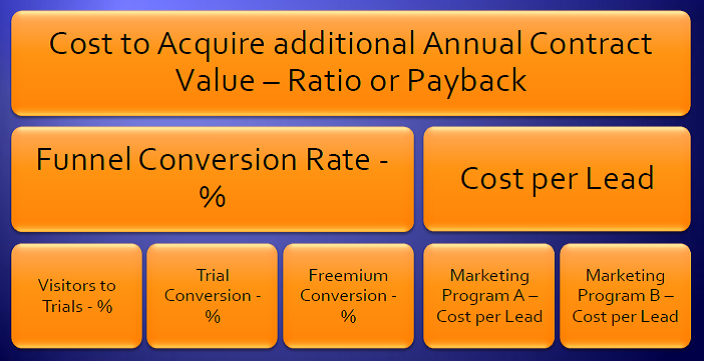
Customer acquisition. The primary metric for measuring the efficiency of customer acquisition is the customer acquisition cost as a ratio to annual contract value. You typically see this one of two ways:
- First, it can be measured as a dollar-based ratio and, for example, expressed as $.xx of customer acquisition cost per $1.00 of annual contract value.
- It can also be expressed as a payback time period ideally based on the gross margin. For example, if the gross margin is 75 percent and there is a one-year payback of customer acquisition cost, that is the same as $.75/$1.00 outlined earlier.
What metrics you use at a more detailed level for customer acquisition depends on how you sell and market your service. However, typically it is important to measure your funnel conversion rates at the key points, such as converting visitors to trials, converting trials to customers and, if you have a freemium offer, converting freemium customers to paying customers. The cost per lead is also important and you should measure it for each of your marketing programs.
Although these items do not measure all of the costs of customer acquisition such as labor costs and commissions, they are recommended because they are the metrics that change the most on a regular basis and the metrics over which you have the most influence.

A metric that is sometimes used is lifetime customer value. This metric is the revenue from a customer over the life of the customer and takes into account churn and upsell. It is an interesting metric. But by its definition it takes a long time to measure actuals and has no value in comparing to other businesses since it is intended to be different for different services and business models. So it is primarily a hypothetical metric and it is much better to focus on the key components that are more easily measured and compared.
R&D investments. To measure R&D for a SaaS business you want to measure whether what was planned was delivered and also measure the efficiency of R&D. This is a substantial topic of its own and R&D is measured essentially the same for a SaaS business as for any other type of technical business.
The right targets
Generally the metrics that you can get publicly on either public companies or through surveys of private companies are gross margin, customer acquisition cost and customer retention. Details below that generally are not available.
The only metric that is always available for public companies is gross margin since it is required in public financial disclosures. Although it can vary a lot by what is included, it can give some good guidelines for comparison.
Customer acquisition cost can be approximated from public financial information by looking at quarterly sales costs and quarterly increases in revenue. Although there are timing issues, you can get a rough idea. Sometimes, particularly if the numbers are very good, customer retention numbers are available on a company’s website; however, survey information is a better source for this information.
Gross margins of public companies can vary substantially and depend on the business model of the company. As a few examples, Salesforce.com is in the 75-80 percent range, SuccessFactors is in the 65-70 percent range and LogMeIn is over 90 percent. Public company averages are in the 60-70 percent range depending on size and maturity. The 2011 Pacific Crest Private SaaS Company Survey, a survey of private SaaS companies showed an average gross margin of 70 percent.
The same survey of private companies showed an average of 94 percent customer retention. A good target number as a best practice is around 95 percent.
Actual numbers on customer acquisition costs are harder to get, but the 2011 Pacific Crest Private SaaS Company Survey results showed the average at $.95/$1.00. A good target for customer acquisition cost payback is one to two years. Less than one year is great but hard to achieve, and greater than two years makes it economically difficult to grow the business in a way that will be profitable.
Another approach to setting targets is to understand what investors are looking for each of these key metrics. First, investors that are focused on SaaS companies want to see that you are measuring the business and have appropriate metrics. Second, they look for retention rates usually above 90 percent. Third, they look for gross margin at a minimum of 70 percent and ideally 80 percent. Fourth, they want to see payback of customer acquisition costs to be 12-24 months. Finally, they want to see improvement plans and an underlying infrastructure that supports measuring and improving the metrics.
Improvement plans
Now that you understand what metrics you want to measure and what the targets should be, the final step is to develop improvement plans for these metrics. Generally you will have the most influence over churn and customer acquisition cost; unless your gross margin is substantially different than what it should be, these items will have the most impact on your business.
When looking at churn it is important to understand the type of churn that you have and the root causes. To develop this understanding use all of the data that you have from all of your data sources including application usage, customer engagement analytics, customer support ticket systems, customer surveys, customer conversations and any other data from front-line support staff.
Often churn measurement focuses on results, but it’s important to identify any leading indicators that may predict that you will have churn. For example, a very simple leading indicator is that usage of your solution is dropping off or the customer has stopped using it entirely. However, many SaaS providers do not have this basic type of information readily available. If you know that a customer is slowing down their usage, you can have the conversation at the time it is happening and understand why. Maybe it is an unrelated customer business issue, but maybe it is something with your solution that you can do something about.
Improving upsell can depend both on the offer you have and whether the information about possible upsell value is being conveyed to the customer. One of my SandHill.com articles, “Three Steps to Improved SaaS Account Growth,” covers this topic in a comprehensive manner.
The most important thing in improvement plans for customer acquisition cost is to have the data and understand what is currently happening and how it can be improved. If you have sufficient volume and do a lot of your marketing and sales online, doing A/B testing can be helpful. Customer engagement analytics can be very helpful in understanding customer behavior throughout the trial process; I covered this topic in detail in anotherSandHill.com article, “Customer Engagement Analytics – Five Steps to Success.”
Some ways to improve gross margins include reducing the cost per unit for the required infrastructure. Since the infrastructure is often outsourced, there is a substantial vendor management aspect to addressing this area. Additionally, making sure that the infrastructure is used efficiently is important, and cloud infrastructure and capacity management are possible solutions. Another substantial cost element is the infrastructure support costs; if this is outsourced, then working with the vendor is the right approach. Automation and DEVOPS can also be important to reducing support costs.
For customer support costs, which are typically part of the gross margin, making sure that the customer is encouraged to use the most efficient support channel and reducing the overall number of transactions will have the potential to reduce costs. However, be careful because saving a few dollars in support costs are never worth causing any increased churn.
If you measure the right metrics, the right targets for the metrics and have improvement plans that you can implement, you will be able to make substantial improvements in your SaaS business. These improvements can result in increased revenue, increased margin to invest and happier customers.
Paul Ressler is a consultant specializing in service delivery for SaaS, cloud computing and managed services. As the principal of The Cirrostratus Group, Paul helps his clients improve customer satisfaction, raise service margins, introduce profitable new services, and transition to the SaaS business model.
