Good news for sales and marketing executives defending their budgets if they are planning on going public soon: The total amount of money in the sales and marketing budget probably isn’t going to be questioned too much. That doesn’t mean that how they spend their money isn’t going to be questioned, or the effectiveness of the spend; but that’s another issue. In looking at sales and marketing spend for IPOs of SaaS companies, OPEXEngine found little deviation in S&M spending.
We took a few leading public SaaS companies and compared their financials in the year that they went public. It was really interesting that despite the fact that these companies went public in different years, with different macro-economic environments ranging from SalesForce’s IPO in 2004 to Cornerstone on Demand and Jive in 2012, there was only a slight variation in S&M spend.
The average among the five companies was 55.7% of revenue spent on sales and marketing in their IPO year. The highest was Cornerstone on Demand with 62.4 percent spent on sales and marketing (resulting in 47.1 percent revenue growth that year), and the lowest was NetSuite, which IPO’ed in 2007 and spent 53.4 percent on sales and marketing. By the way, NetSuite consistently spent about 50 percent on sales and marketing through 2012. NetSuite’s market cap at the end of 2012 was almost 15.5 times their 2012 revenue, the highest revenue to market cap multiplier among public SaaS companies.
The standard deviation for these IPOers was only 3.84, meaning they were all quite close to the average of 55.7 percent for this group.

Source: OPEXEngine Financial Insights Reports – Peer Group Analysis
Greater S&M deviation for larger group, mostly not in IPO year
When we looked at a bucket of 29 SaaS companies and took the average spend for sales and marketing in 2012, it was 37.2 percent with more variation among the companies. Sales and marketing spend ranged from the low 20 percent range to 62.4 percent. Generally, the companies with the lowest sales and marketing spend tended to be vertically oriented companies versus the companies selling to a horizontal market with a broader application clustering in the higher sales and marketing spend levels.
Comparing sales and marketing spend to revenue growth
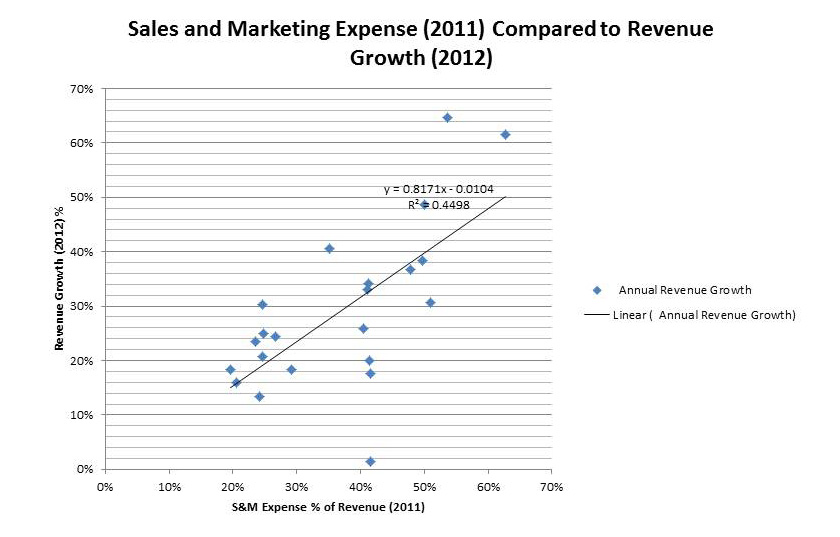
Next, we looked at the overall SaaS bucket of 29 companies, and compared 2011 sales and marketing spend to 2012 revenue growth to see if there is a correlation. Surprisingly, the data was pretty strong, showing almost a 50 percent correlation between sales and marketing spend and revenue growth. Of course, there are some outliers that spent above the average in sales and marketing and got very little revenue growth, but that may reflect a particular company’s situation in the market, with a product, difficult market position, management change, etc. The data is fairly compelling that companies can associate S&M spending with increasing revenue growth.

Source: OPEXEngine Financial Insights Reports – Peer Group Analysis
At the same time, it should be remembered that the correlation between sales and marketing spend and revenue growth one year later is not 100 percent; and other factors such as how the money is actually spent, how well the product is doing in the market, management effectiveness and the size of the overall market, among many other factors, will affect revenue growth.
We always point out that benchmarks are not a blueprint for your financial model but, rather, it is important to know how you stand in relation to the benchmarks and then dig in and make the right choices for your company in relation to the benchmarks.
We’ll be looking closely at sales and marketing spend, as well as a comprehensive set of other financial and operational metrics such as detailed departmental expense numbers, hosting expense, departmental and geographic headcounts, revenues and growth rates, profit and margin metrics and more in this year’s confidential software and SaaS benchmarking, which is open from March 1 through April 15. Because we collect more detailed data from companies in the confidential benchmarking, we are able to get a better look at effectiveness and other performance measures, to help companies drive fast growth. Register now for more information and get started.
Lauren Kelley is CEO and founder of OPEXEngine. She brings 25 years of tech company management experience to OPEXEngine, as well as six years as an international economist at the U.S. Department of Commerce’s Office of Computers. She managed worldwide sales and strategic development for ecommerce pioneer, Art Technology Group, managed 20 countries for Borland Software, and helped build Compaq Computer’s business in Eastern Europe in the early 1990s. Ms. Kelley is currently based in Boston and has previously lived and worked in London, Paris, Munich, Bonn, Berlin, Kingston, Jamaica, and Cleveland, Ohio. Contact her at lauren@opexengine.com.
