There’s no doubt that 2017 will be remembered as a wild year in U.S. markets: A year-long “Trump rally” topped by massive corporate tax cuts overshadowed warnings of a new “bubble,” a slowdown in venture capital fundraising, and fewer-than-expected exits.
Yet, throughout it all, tech companies held their own, according to the latest full-year 2017 data from PitchBook-NVCA Venture Monitor. Why? Software-driven startups remain an attractive acquisition target by non-tech category leaders. And clear leaders in the new tech platforms such as big data, fintech and the sharing economy are finally beginning to take off, financially.
But logging the largest VC investment total since the dotcom days, observers can’t help but ask, “Is this a bubble?” Last March, SandHill.com founder M.R. Rangaswami said “no” – and tech analysts tend to agree, predicting 2018 will be a big year for innovation adoption in the enterprise.
PitchBook also points to anti-bubble behaviors: The firm believes the venture industry continues to proceed cautiously, which translates to older startups, larger investment rounds, fewer exits, and more involvement of corporate VC and growth equity investors. Read on for the analyst firm’s data points that highlight key deal-flow dynamics from 2017:
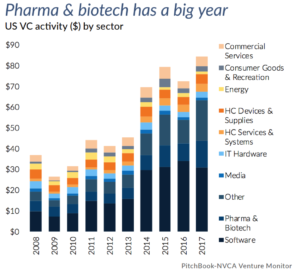
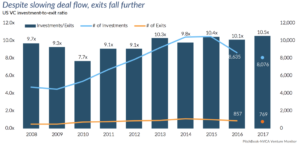
“The fourth quarter of 2017 bookended the year as the third consecutive quarter with more than $20 billion deployed into US venture-backed companies, and marked the close of a strong year of investment that surpassed $80 billion annually for the first time since the dot-com era. Investors deployed $23.75 billion into 1,772 companies in 4Q, the fewest since 4Q 2011, bringing the annual total to 7,783 and marking the lowest level since 2012.” – PitchBook
“Round sizes have also continued to increase and have shown no sign of slowing down, growing at a rapid pace across the entire venture lifecycle. At $6 million, early-stage rounds came in roughly 20% higher than what we saw in 2016, with late-stage rounds growing 14% to $11.4 million. This, coupled with the rounds completed by aging companies that continue to push off full liquidity events, has resulted in a profound rise in private company valuations, particularly at the late stage where we saw median Series D+ valuations jump to $250 million last year, a hike of over 85% relative to the already large $135 million figure we saw in 2016.” – PitchBook
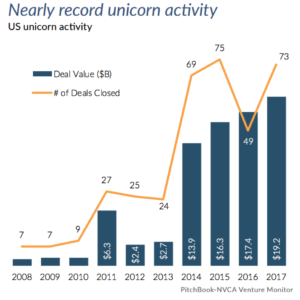
“Investment into unicorns (i.e., those valued at $1 billion+) occurred at a frenetic pace, reaching a record high in 2017. These companies attracted $19.1billion last year, which represented 23% of the total capital invested across the industry.” – PitchBook
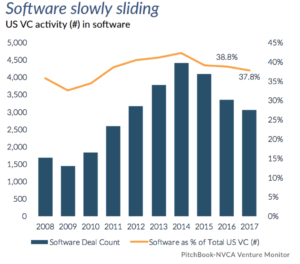
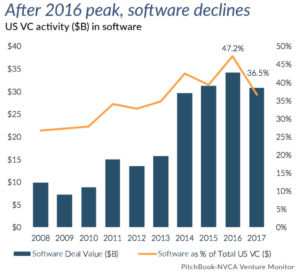
“Though their absolute number and value of venture deals declined in 2017, software startups accounted for more deals and investment than any other sector (38% and 37% of annual totals, respectively.)” – SandHill.com
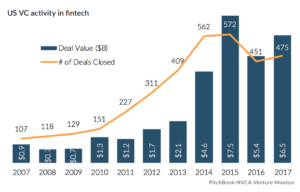
“As with other tech industry sectors, we are seeing a flight to quality: VCs are focusing investment on the “best of breed” fintech companies. In this environment, we believe fintech infrastructure companies are poised to continue to drive innovation in financial services by providing the tools and services that will become even more critical for other fintech companies and incumbent financial services firms to start and survive.” – Silicon Valley Bank from PitchBook
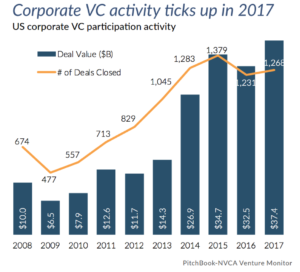
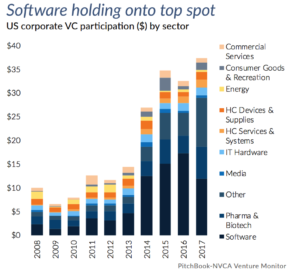
 “Corporate venture investors have continued to play a growing role within the US VC industry, participating in rounds that amounted to 44% of all 2017 venture deal value… CVCs participated in roughly 29% of all venture financings completed above $25 million last year, the highest proportion we’ve seen since at least 2006… Software remains the top target for CVC.” – PitchBook
“As growth equity has grown, the median size and valuations of such deals has skyrocketed. Software and other tech firms remain the top recipient of growth equity backing.” – PitchBook
“Despite counts moving lower, sales have been significantly larger and aggregate exit value has remained heightened. 2017 saw more than $51 billion exited across some 769 liquidity events, equating to a marginal YoY decline of 3.6% in terms of aggregate exit value, yet a drop of over 10% in terms of volume.” – PitchBook
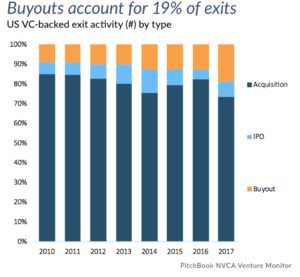
“Nearly $7 billion worth of venture-backed exits were completed by private equity last year across 146 sales, reflecting YoY growth of over 200% in terms of total exit value, and a jump of 33% in terms of completed sales to PE. With the proliferation of both techfocused private equity funds, as well as a lending ecosystem that has grown to better understand how to stack debt against recurring revenue software businesses, we expect this outlet to remain in place for venture-backed management teams.” – PitchBook
“While coming in lower than the total amount of capital raised in 2016, on a historical basis, managers were still able to garner considerable success on the fundraising trail last year. More than $32 billion was raised across 209 completed closes.” – PitchBook
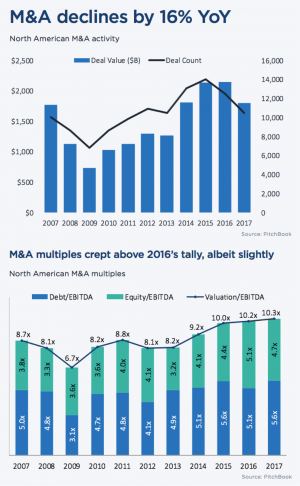
“M&A activity in North America totaled $1.8 trillion across 10,465 deals in 2017—trailing 2016 by 16.0% and 16.1%, respectively. The slowdown comes despite sound economic indicators in the US, including sustained growth in manufacturing, strong corporate earnings growth and record-high CEO sentiment.” – Dylan E. Cox, PitchBook
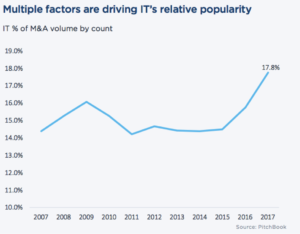
“Acquisitions of technology companies accounted for a record 17.8% of all M&A deals in 2017—a full two percentage points higher than the prior year. The relative resiliency of the tech sector can be attributed to a variety of factors. Chief among them is that non-tech incumbents use these transactions to adapt to changing distribution channels and consumer preferences.” – Dylan E. Cox, PitchBook
For more analysis and data, visit the NVCA/PitchBook site for the full venture capital report and click here to download the PitchBook 2017 Annual M&A Report.
Clare Christopher is editor of SandHill.com.


